Poor man’s “Data” breakpoints in managed debugging
One of the things that is really annoying with unmanaged code is that it is easy to overwrite memory that doesn’t strictly belongs to you. That can lead to interesting corruption bugs, especially if the problem occurs only a while after the actual change happened. This is why it is so good to have a memory breakpoint. That will force a breakpoint in the debugger when a particular memory location is written. However, in VS, those are only available for unmanaged code, not for managed code that directly manipulate memory.
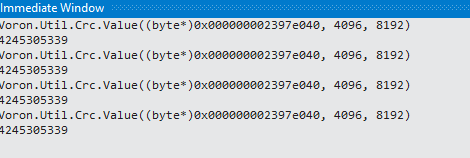
Therefor, I resorted to using the following method, instead:
I run in the debugger, and issue this statement after every line, waiting for that value to change, which will tell me what line is the culprit.
Not as easy, but it works.


Comments
How close is Voron to being production-ready?
dhasenan, Come to my talk today, I'll talk about this.
Unless voron has 10,000x (or possibly another order of magnitude even) perf improvements, you will need to pry esent out of my cold dead hands. I trust raven because it's built on a storage persistence engine that has a 20+ year track record.
Chris, Voron right now can do over 1 million reads per second. That is a quite a lot. But we aren't letting Esent go, by any means.
Maybe I'm stating the obvious, but it sounds like a filtered breakpoint that triggers on that expression's value changing might be handy instead of doing it in the immediate window by hand at each step. Either set one on every line or if there are too many then set it in a few key places to narrow it down (a hillbilly binary search?)
Brian, I am not sure if that would've worked, but that is certainly an option.
Comment preview